In the 2010 Census, nearly 1 million children (4.6% of children under the age of 5) were not counted, according to the U.S. Census Bureau. Census data helps federal, state, and local governments make policy decisions and determine how to distribute funds for programs closely related to children’s health and education. Children not counted in the census can impact a community for at least 10 years until the error is corrected. For school leaders, every child matters, and accurate information supports school districts in strategically planning for funds and resources that are needed to provide every student with high-quality education.
Hard-to-Count Populations
Young children, non-English speakers, and low-income persons are among the list of hard-to-count populations for the 2020 Census. Based on data of the 2010 Census and the American Community Survey (ACS), the Census Bureau calculated the projected response rate in the 2020 Census for every block group in the nation. Block Groups (BGs) are statistical divisions of census tracts, which are small, relatively permanent statistical subdivisions of a county or equivalent entity that are updated by local participants prior to each decennial census. Block groups are generally defined to contain between 600 and 3,000 people.
To support the 2020 Census, the Southeast Michigan Council of Governments (SEMCOG) – a regional planning partner with local governments – developed the “Hard to Count Populations map,” using the data from the Census Bureau. The map can be used as a tool for leaders in Southeast Michigan to see which block group is projected to have a response rate below 75% in 2020. Additionally, the map tool provides five indicators that may contribute to the lower Census response rates. The indicators are percentages of:
- population age 4 and under
- population age 18-24
- renter-occupied housing units
- population below the poverty level
- population who have difficulty speaking English
The Center for Public Education (CPE), a research branch of the National School Boards Association (NSBA), examined the data of the block groups that are projected to have low response rates in Southeast Michigan. What we found is cause for concern.
Table 1.
Block groups in Southeast Michigan that were projected to have low response rates in the 2020 Census
| Block group (Census Tract and group number) | Population under the age of 5 | Population age 18-24 | Population below the poverty level | Difficulty speaking English | Renter-occupied housing units |
| in Ann Arbor, Ann Arbor Twp, Washtenaw County (4022004) | 0.0% |
94.7% |
72.1% |
19.4% |
72.1% |
| in Ann Arbor, Washtenaw County (4002001) | 0.0% |
98.0% |
71.5% |
0.0% |
100.0% |
| in Detroit, Wayne County (5122001) |
21.8% |
13.9% |
90.7% |
0.0% |
100.0% |
| in Detroit, Wayne County (5302003) |
36.8% |
25.2% |
71.4% |
0.0% |
56.5% |
| in Detroit, Wayne County (5006002) | 8.7% |
25.4% |
70.0% |
0.0% |
81.2% |
| in Detroit, Wayne County (5468002) |
24.8% |
9.8% |
56.2% |
0.0% |
100.0% |
| in Detroit, Wayne County (5173002) |
12.9%; |
8.6% |
50.7% |
0.0% |
100.0% |
| in Detroit, Wayne County (5441003) |
12.2% |
20.4% |
40.3% |
3.9% |
100.0% |
| in Detroit, Wayne County (5006003) |
16.1%; |
11.4% | 25.0% | 0.0% |
100.0% |
| in Sterling Heights, Macomb County (2323003) |
17.2% |
0.0% |
82.8% |
0.0% |
100.0% |
| in Wixom, Oakland County (1331001) |
17.9%; |
24.2%; |
42.1%; |
9.9% |
100.0% |
| in Ypsilanti, Washtenaw County (4111001) | 0.4% |
93.9% |
68.8%; |
15.3%; |
100.0%; |
% is one standard deviation above regional average
Data source: https://maps.semcog.org/HardToCount/
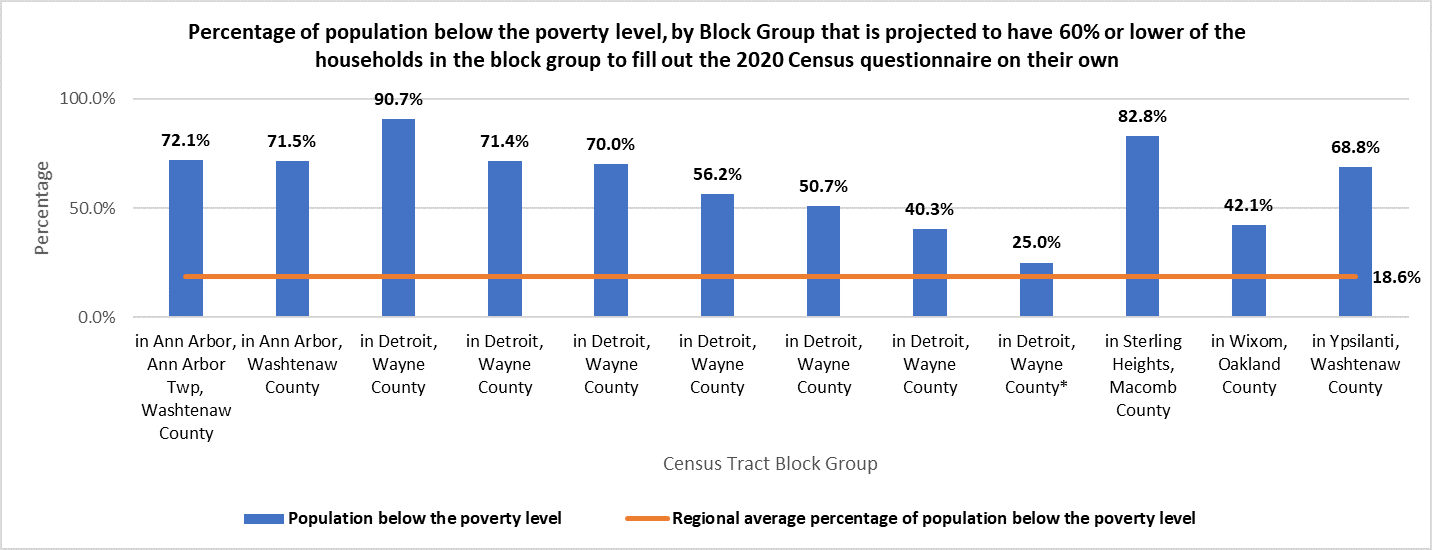
Table 1 shows that there are 12 block groups in Southeast Michigan where only 60% or fewer of the households may fill out the 2020 Census questionnaire on their own. The following are the characteristics of the 12 block groups:
- The poverty level is much higher than the regional average level — in 11 block groups, the percentage of the population below the poverty level is one standard deviation above the regional level, and in 6 block groups, more than 70% of the population lives below the poverty level (Figure 1);
- Most of the households do not own the place where they live — in 9 block groups, 100% of the residents are renters; and
- There are more young children, compared with other neighborhoods in the region —in 8 block groups, the percentage of children under the age of 5 is one standard deviation above the regional level.
In summary, the data give us a disconcerting picture — undercounted young children are more likely to be living in the high-poverty neighborhood.
Figure 1.
Data source: https://maps.semcog.org/HardToCount/
Overcrowding in schools
Accurate data should be used to project school enrollment. Projections based on missing data about children may pose a significant challenge to school leaders when handling issues such as classroom crowding and teacher shortages.
- Alexandria City Public Schools (VA) started redistricting in 2019, because enrollment has been growing by an average of 500 students a year since 2011 and is expected to continue growing through 2030, which has created overcrowding in the schools.
- The Kirkwood School District (MO) has been faced with increasing enrollment and hopes to use redistricting attendance boundaries to solve issues about class sizes and the growing enrollment of its student population.
- It is just the beginning of 2020, but the school leaders of Manheim Township School District (PA) have begun to plan how to prepare for the projected increased student enrollment; redistricting is discussed as an option.
Redistricting attendance boundaries is a strategy often used by school leaders when student enrollments grow. It is unclear whether there is any relationship between redistricting and undercounting children in the Census. However, if children living in high-poverty communities were not counted in the Census, the missing information could lead to a shortage of funds and resources that children need for their life and education.
According to the Census Bureau, “The 2020 Census count impacts the federal funds that communities receive each year for programs and services that are critical for schools, students, and young children, such as: Special education, Head Start, after-school programs, and classroom technology.” Based on the data from SEMCOG (Table 1), we examined the school districts in Detroit metropolitan area in Wayne County, where 7 block groups are projected to have low response rates in the 2020 Census. We further looked at this region using the data of school district boundary changes from the U.S. Department of Education (2019) and Michigan state report cards.
Our research question is whether school districts that changed boundaries from 2010 to 2019 had increased resources and showed improved academic performance of students in areas with more projected hard-to-count populations. We found that among the eight school districts that changed school boundaries in Detroit metropolitan area in Wayne County, between SY2015-16 and SY2018-19:
- Six districts increased in area (four in SY2015-16, two in SY2009-10);
- All eight districts had an increase in total funds (range 29% -534%);
- Six districts had an increase in instructional expenditures per pupil (range 2%-13%);
- Four districts decreased K-3 class size, but the other four districts increased the class size;
- Five districts increased teacher’s salary by 1-5% on average, but three districts decreased teachers’ salary by 1- 4% on average;
- Five districts saw a decrease in the percentage of students who were proficient in math and English in grades 3-8.
The research we conducted is limited. Although redistricting may partially solve issues related to budget shortages and/or overcrowding in the classroom, the data show that the academic performance of students in some districts did not improve after redistricting. While teachers’ salaries were increased in some districts, it is still questionable whether redistricting can help to retain and recruit good teachers. Some research indicates that redistricting can increase educational inequality, increase segregation within schools, and hurt already disadvantaged students and communities.
How can school leaders use the data of hard-to-count populations?
The data of hard-to-count populations are relevant to many school districts. According to the framework for hard-to-count populations developed by federal agencies, hard-to-count populations can be people who are hard to interview because their participation is hindered by language barriers, low literacy, and lack of internet access. In recent years, many school districts experienced a rapid growth of immigrant students, and nationwide:
- 45% of immigrant parents of young children are low-income;
- 47% of immigrant families have limited English proficiency; and
- 45% of immigrant parents have less than a high school diploma.
Data tools like the regional map developed by SEMCOG can assist school leaders to visualize where the hard-to-count populations are and identify whether their districts have such populations. For school districts that have hard-to-count populations, educational programs focusing on the 2020 Census — such as parents’ night, a lesson plan on Census — may help the community to get on board. Ultimately, to increase the awareness of participation and empower both students and parents with knowledge about the 2020 Census is in the long-term interest of schools.
School leaders can and should help those children whose voices are not often heard and those populations who are often unseen, unknown, or unrepresented. Knowing who these populations are and where to find them, school leaders can focus on creating/developing awareness with those populations of the importance to participate in the Census and the negative impact that not participating may have. “In 2020, we have the chance and opportunity to make a greater impact on those families and those children and the resources their communities may receive, impacting them into the year 2030,” says NSBA’s 2019-20 President ElizaBeth Branham.

Share this content